A / The line
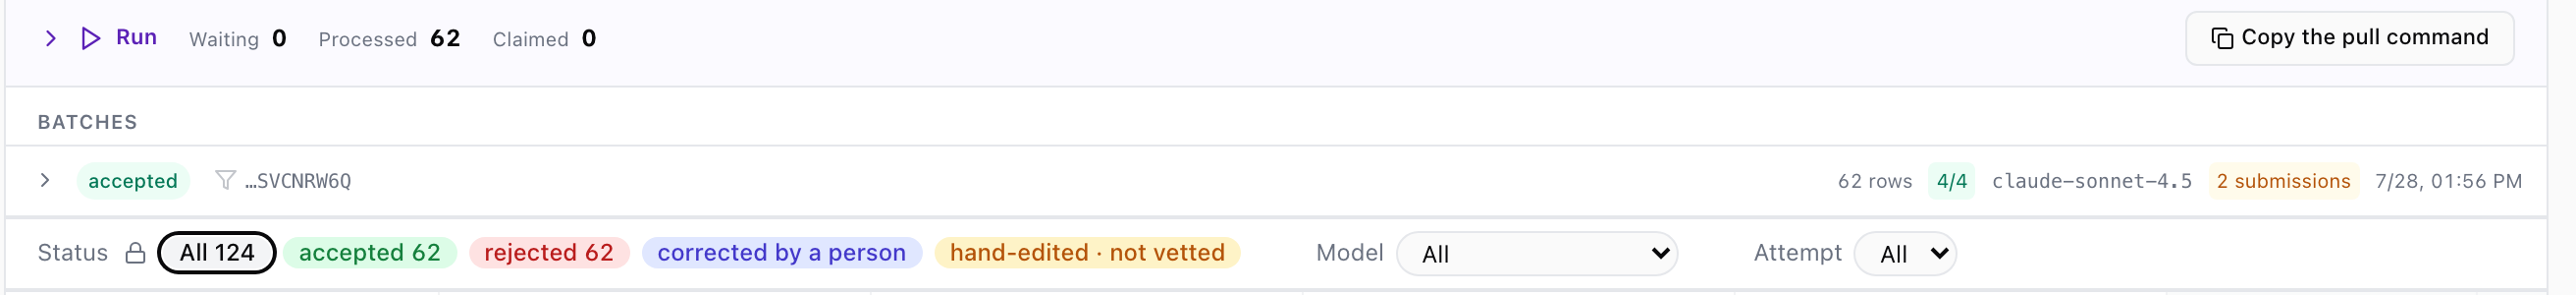
Accepted output stays attached to its source.
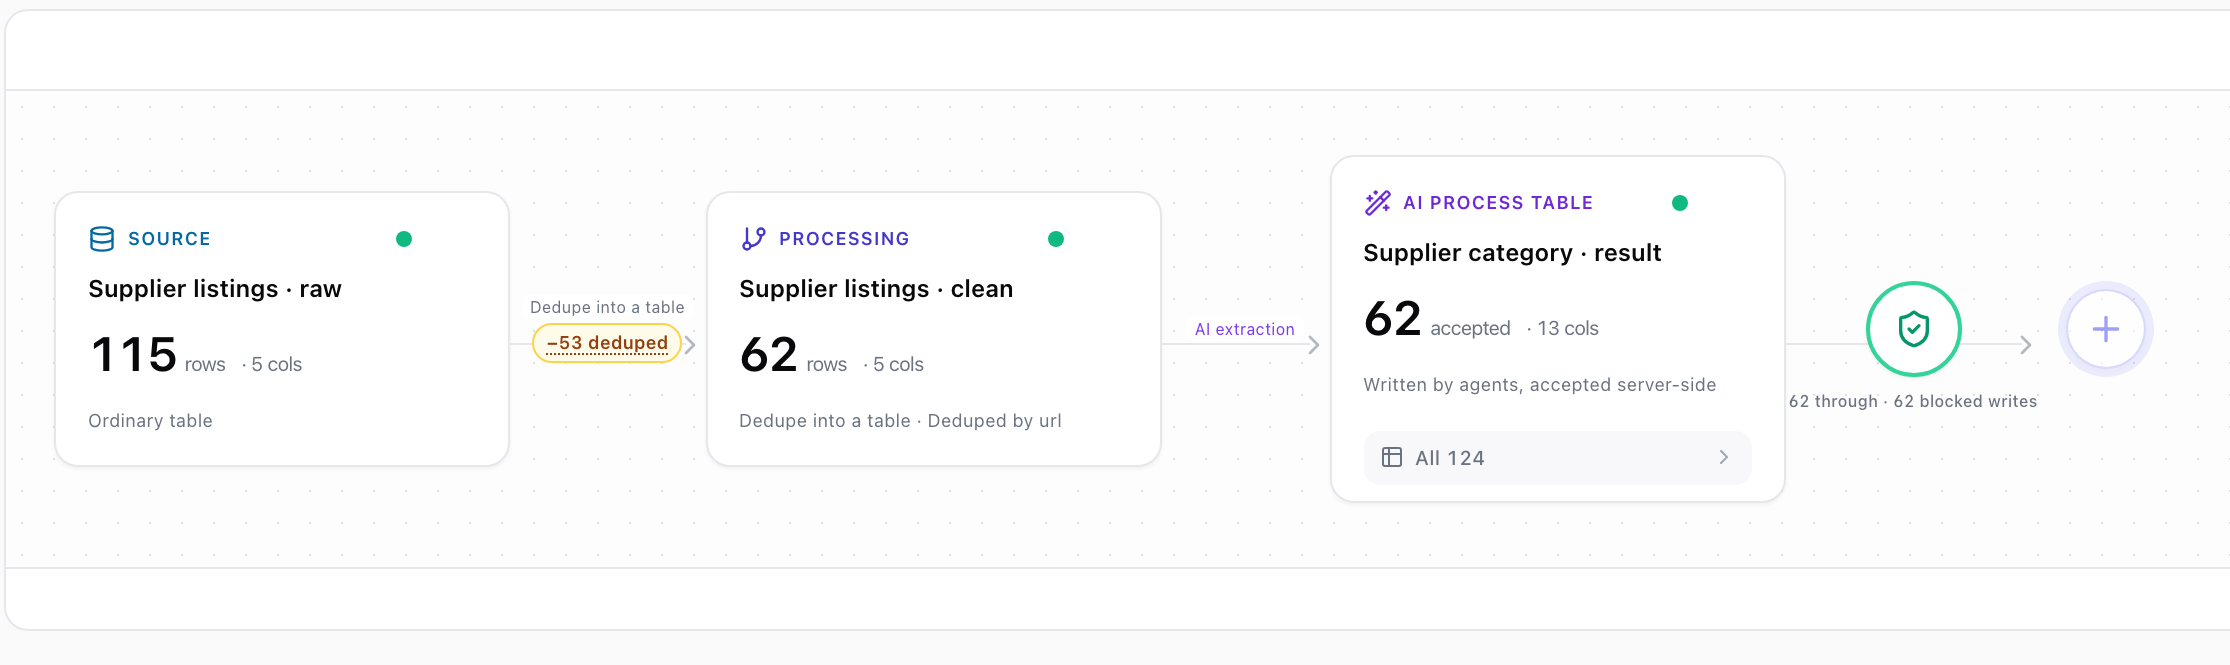
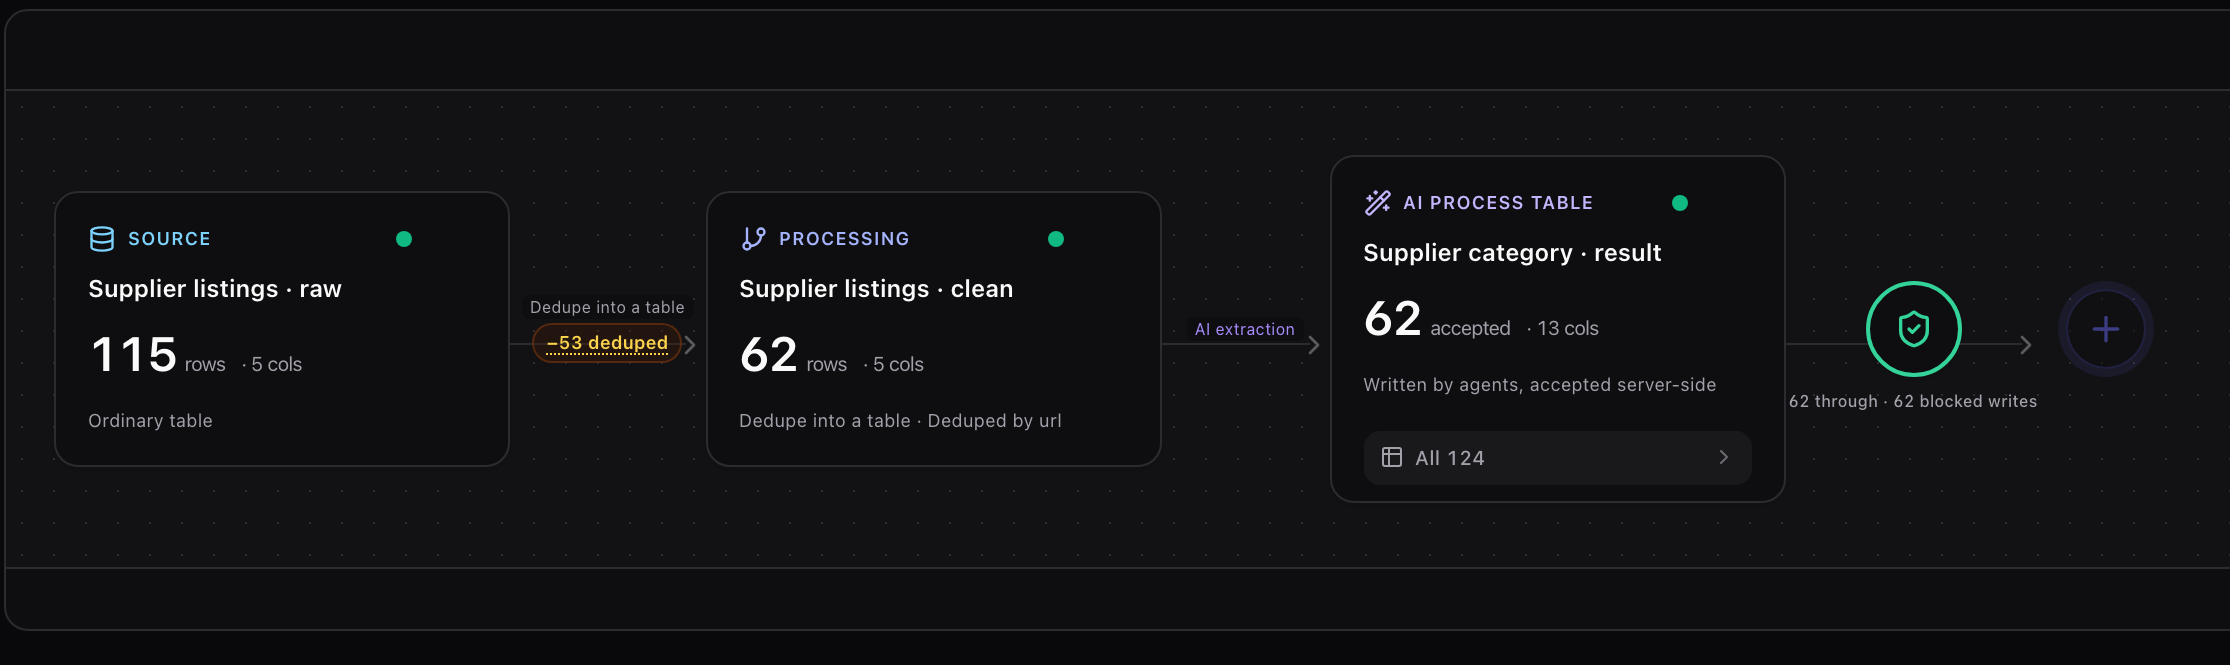
The whole edge on one canvas: 115 raw rows, 53 folded away by url, 62 clean rows, the extraction, and the gate.
The label on the edge leaving the gate is the product's own, not a caption we wrote: 62 through · 62 blocked writes. Recorded but not promoted, drawn on the line itself.
app.tablize.com · workspace canvas2026-07-28 · 100% zoom